Project Details
A More Detailed Look at the Project Specifics

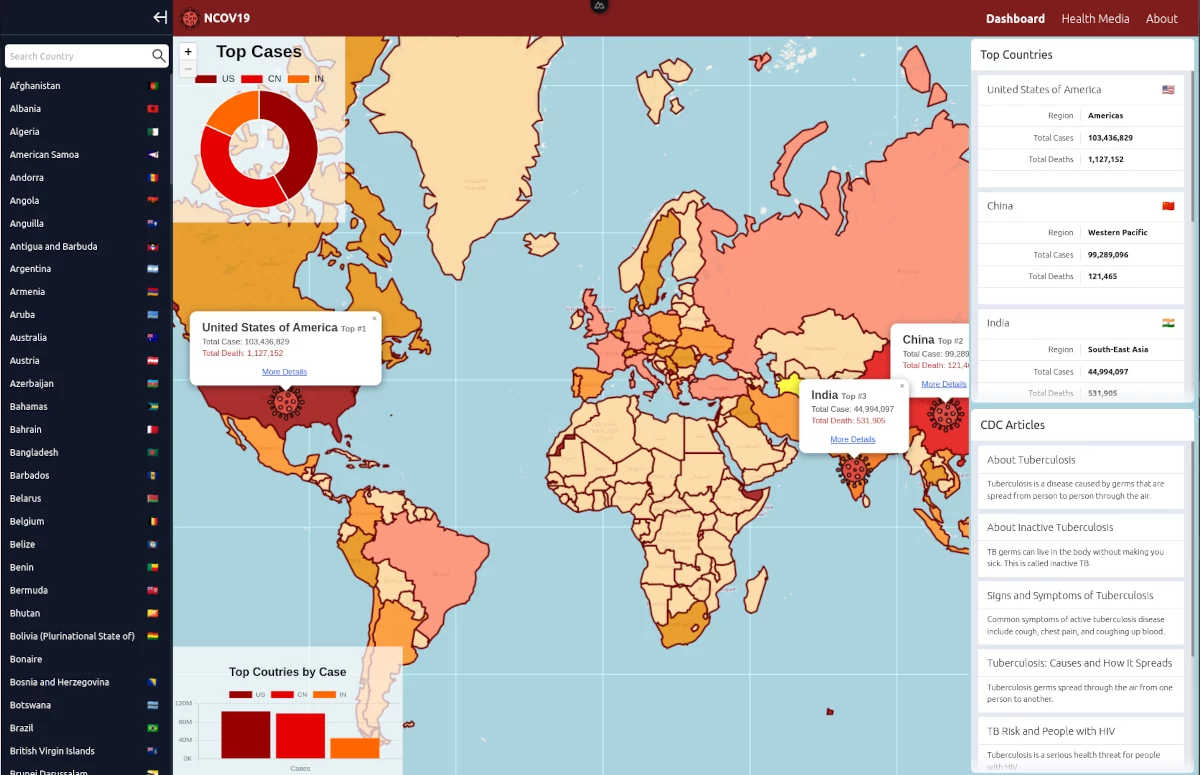
Ncov-19 Tracker
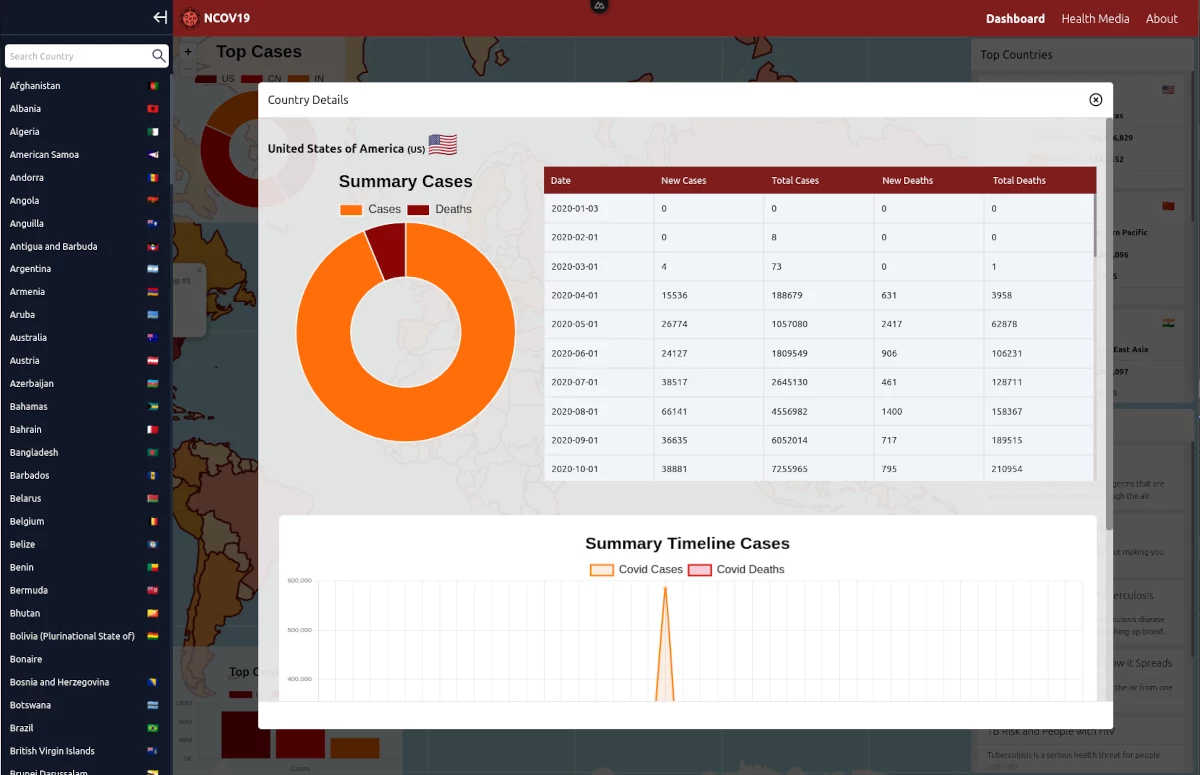
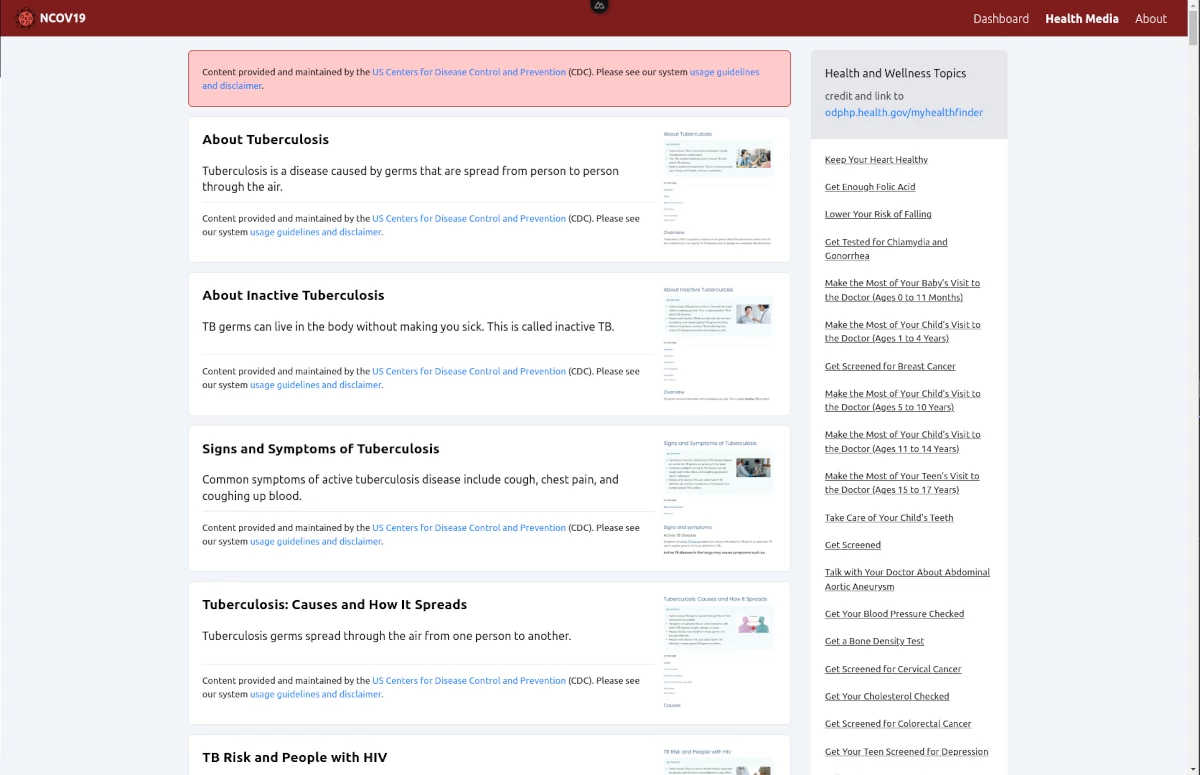
Ncov19 is a project I developed during the COVID-19 pandemic to visualize data on confirmed cases, deaths, and recoveries. The app uses Chart.js for interactive graphs and Leaflet.js to create a color-coded map highlighting regions with high case numbers. A media page features articles from health.gov, while the COVID-19 data is sourced from WHO and CDC, providing users with accurate information at the time.
Created: 5 years ago
Updated: 2 years ago
However, the project has not been updated for some time, and some data may now be outdated or unverified.
Let’s Get in touch
I’m always open to discussing new ideas, collaborations, or opportunities. Drop me a message, and let’s connect!
Dicord Message
To be added soon...
Kakao Talk
To be added soon...